Call for collaboration
I’m looking for a web developer to collaborate with me on a client side browser based app that will take an uploaded image and then display the colours in the image as points in the 3D Munsell colour space.
Why make this?
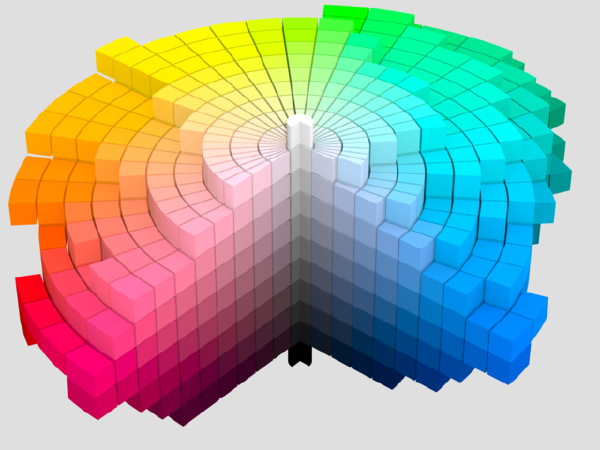
Getting to know the Munsell colour space has helped me immensely with my understanding of colour. The space is three dimensional (like any colour space) and is shaped approximately like a cylinder with the long axis representing value (how dark or light a colour is), the radial axis representing hue, and the distance from the central axis representing chroma (how saturated a colour is). Black to white run up the central axis, and the brightest colours sit around the outside of the cylinder.
This is a colour space based on perception, so the distance between 3 and 4 on the value scale looks the same as the distance between 6 and 7, and so forth for the other axes. This consistency is very useful for painting where we never need to know the exact wavelength of the light, but whether a red is halfway between the bright highlight and the dark shadow is very important.
I think about moving around in this space when I’m mixing, and I’m now I’m more able to place the colour I’ve mixed in the space and to compare it to my target colour. With the three dimensions clearly defined, it is easier to see if one colour is more saturated or more grey than the other, or lighter or darker in value, or warmer or cooler in hue. I would like to be able to analyze the colours in a painting the same way by plotting them all in the Munsell colour space.
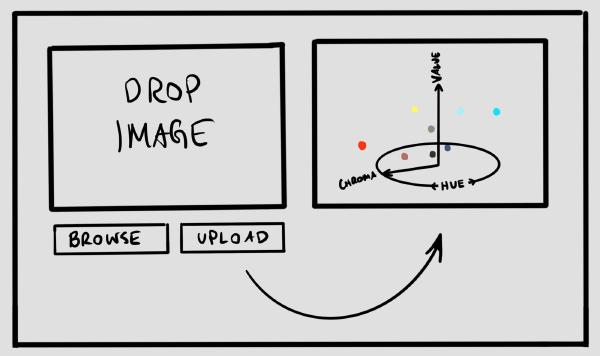
To do this, I envision uploading an image and then getting a plot back that displays all the colours used in the Munsell colour space. This way I could quickly see what the lightest colours in value in the image are, what the most saturated colours are. What sort of colour bias there is in the image, what limited palette has been used, and so forth.
This sort of information is usually displayed on the colour wheel, hue around the outside, and chroma decreasing towards the middle. This depiction is fine, but it’s only part of the picture because it leaves out value entirely. A light red and a dark red would appear in the same place on the colour wheel, but are very different colours.
I think such a visualisation would be useful to more people than just myself, so I would like to have it on this site and make it available for folks to use. It seems so simple that this must exist already, but I really haven’t been able to find anything like it.
How to build it?
To make such a tool available and to reduce the barrier to using it, it should be a browser based client side application. Upload an image of an artwork, and the app will extract the colours in the image and display them in the 3D Munsell cylinder. You’d be able to click and drag to rotate the 3D space to see all sides of it (and ideally, would also provide projections along two of the axes, hue, value, or chroma, to better see the space).
The catch is that although I used to do programming as a career, that was decades ago and I never really learned javascript. And I’m so disconnected from tech these days that I don’t even know if javascript is the right language to use anymore.
So I’m putting out this call. Would you like to work on this with me? I’d like to structure the project such that you write the general framework, and then I’ll implement some extensions to it (such as displaying the 2D projections) which will be a good way for me to learn the code.
I think this tool would be useful to anyone trying to understand colour, anyone interested in art, anyone interested in making a fun, colourful online tool. Email me at if you think this would be cool.
Previous Next